
Gantt Chart for Project Scheduling
A Gantt chart is a project management tool that helps in planning, scheduling, and monitoring a project.
A Gantt chart is a project management tool that helps in planning, scheduling, and monitoring a project.
A Gantt chart is a horizontal bar chart used to display the start date and duration of each task that makes up a project.
It represents all information visually through a horizontal bar graph.
Project managers and team members can view the task schedules, dependencies, and progress by just glancing at the chart.
Components:
Y-axis: Represents the tasks in the project.
X-axis: Represents the duration of each task.
Bars: Each task is represented by a bar, and the length of the bar indicates its duration.
Overlapping Bars: If two bars overlap on the X-axis, they occur simultaneously.
Get started with this template right now.
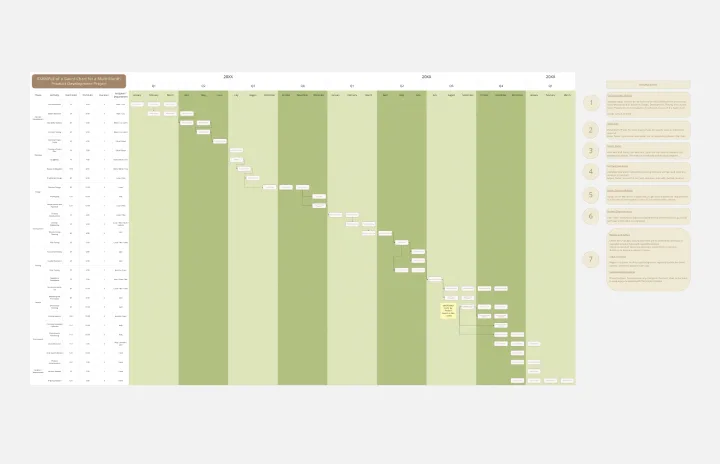
Product Development Gantt Chart
Works best for:
Gantt Chart, Planning
Developing a new product involves many steps and stakeholders. The Product Development Gantt Chart template helps you manage this complex process efficiently. Use it to outline each phase of development, set timelines, and assign responsibilities. Track progress and make adjustments as needed to stay on schedule. This template provides a clear visual representation, coordinating tasks for a successful product launch.

Lesson Plan Template
Works best for:
Education
Use the Lesson Plan to inform everyone about assignments, get clarity when planning lessons, and align your student’s expectations. Many educators use the Lesson Plan template to organize their teaching material and assess learning experiences and insights into students’ progress and interests. The Lesson Plan is an excellent tool for giving students an overview of the learning plan and connecting deeper with the topics and the study sessions.

B2B – Product Journey Map & User Network
Works best for:
Planning, Product Management
The B2B Product Journey Map & User Network template helps product teams visualize and understand the complex journey of B2B customers. By mapping user interactions, pain points, and touchpoints across the buyer's journey, this template provides insights into user behavior and preferences. With sections for analyzing user needs, identifying opportunities, and optimizing user experiences, it enables teams to design tailored solutions and drive customer satisfaction. This template serves as a strategic tool for enhancing B2B product offerings and maximizing customer value.

Mandala Chart Template
Works best for:
Planning, Brainstorming, Goal setting
The Mandala Chart Template helps you visualize the relationships between a central theme and its sub-themes. One of the key benefits is how it fosters a holistic understanding of any topic. This perspective ensures every detail is noticed, making it an invaluable asset for those aiming for comprehensive insight and thorough planning or a better understanding of their goals.

Product Canvas Template
Works best for:
Desk Research, UX Design
Product canvases are a concise yet content-rich tool that conveys what your product is and how it is strategically positioned. Combining Agile and UX, a project canvas complements user stories with personas, storyboards, scenarios, design sketches, and other UX artefacts. Product canvases are useful because they help product managers define a prototype. Creating a product canvas is an important first step in deciding who potential users may be, the problem to be solved, basic product functionality, advanced functionalities worth exploring, competitive advantage, and customers’ potential gain from the product.

Timeline Design ⏳
Works best for:
Timeline, Planning
The Timeline Design template is perfect for creating visually engaging timelines. It helps you showcase project milestones, deadlines, and important events in a clear and attractive format. Ideal for presentations and reports, this template ensures your timeline is both informative and visually appealing.