Azure Demand Forecasting Template
Visualize a demand forecast structure to simplify predicting data usage, costs, and outcomes.
Available on Enterprise, Business, Education plans.
About the Azure Demand Forecasting
The Azure Demand Forecasting diagram will show the architecture of a demand forecast, making it easier for you to predict data consumption, costs, and forecast results. Azure is Microsoft’s cloud computing platform, designed to provide cloud-based services such as remote storage, database hosting, and centralized account management.
Keep reading to learn more about the Azure Demand Forecasting Template.
What is an Azure Demand Forecasting Template
The Azure Demand Forecasting Template, like any other diagram, visually shows the necessary steps for demand forecasting. The Azure Demand Forecasting Template has unique icons categorized into Stencils. Each Stencil focuses on a specific task to make it easier for users to access the right set of icons.
When to use Azure Demand Forecasting Template
You can use the Azure Demand Forecasting Template to predict demand for a product in a retail/online store, forecast hospital visits, and anticipate power consumption.
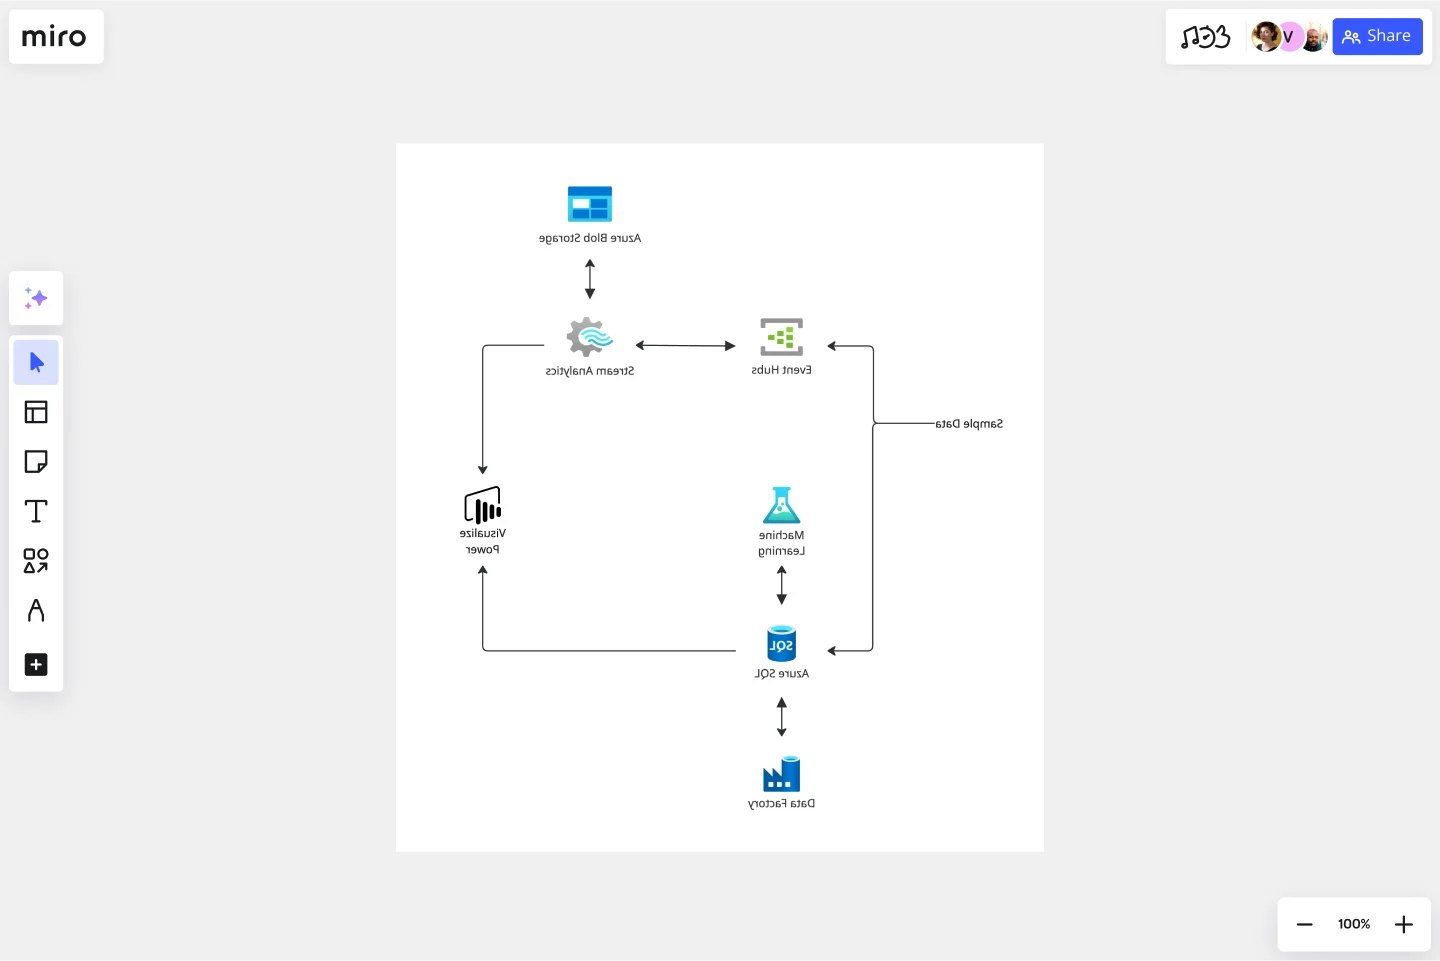
The Azure Demand Forecasting Template combines several Azure services to provide actionable predictions:
Event Hubs collects real-time consumption data.
Stream Analytics aggregates the streaming data and makes it available for visualization.
Azure SQL Database stores and transforms the consumption data.
Machine Learning implements and executes the forecasting model.
Power BI visualizes the real-time energy consumption and the forecast results.
Finally, Data Factory orchestrates and schedules the entire data flow.
How-To Section:
Here are some of the Stencils and their meaning when implementing the Azure Demand Forecasting Template:
How do I make an Azure Demand Forecasting Template?
To make an Azure Demand Forecasting in Miro is easy. You can use our Azure Demand Forecasting Template and customize it as you see fit. Once you have the diagram structure, you can start adding the icons. You can find the icons under our Azure Icon Set integration.
Get started with this template right now. Available on Enterprise, Business, Education plans.
AWS Architecture Diagram Template
Works best for:
Software Development, Diagrams
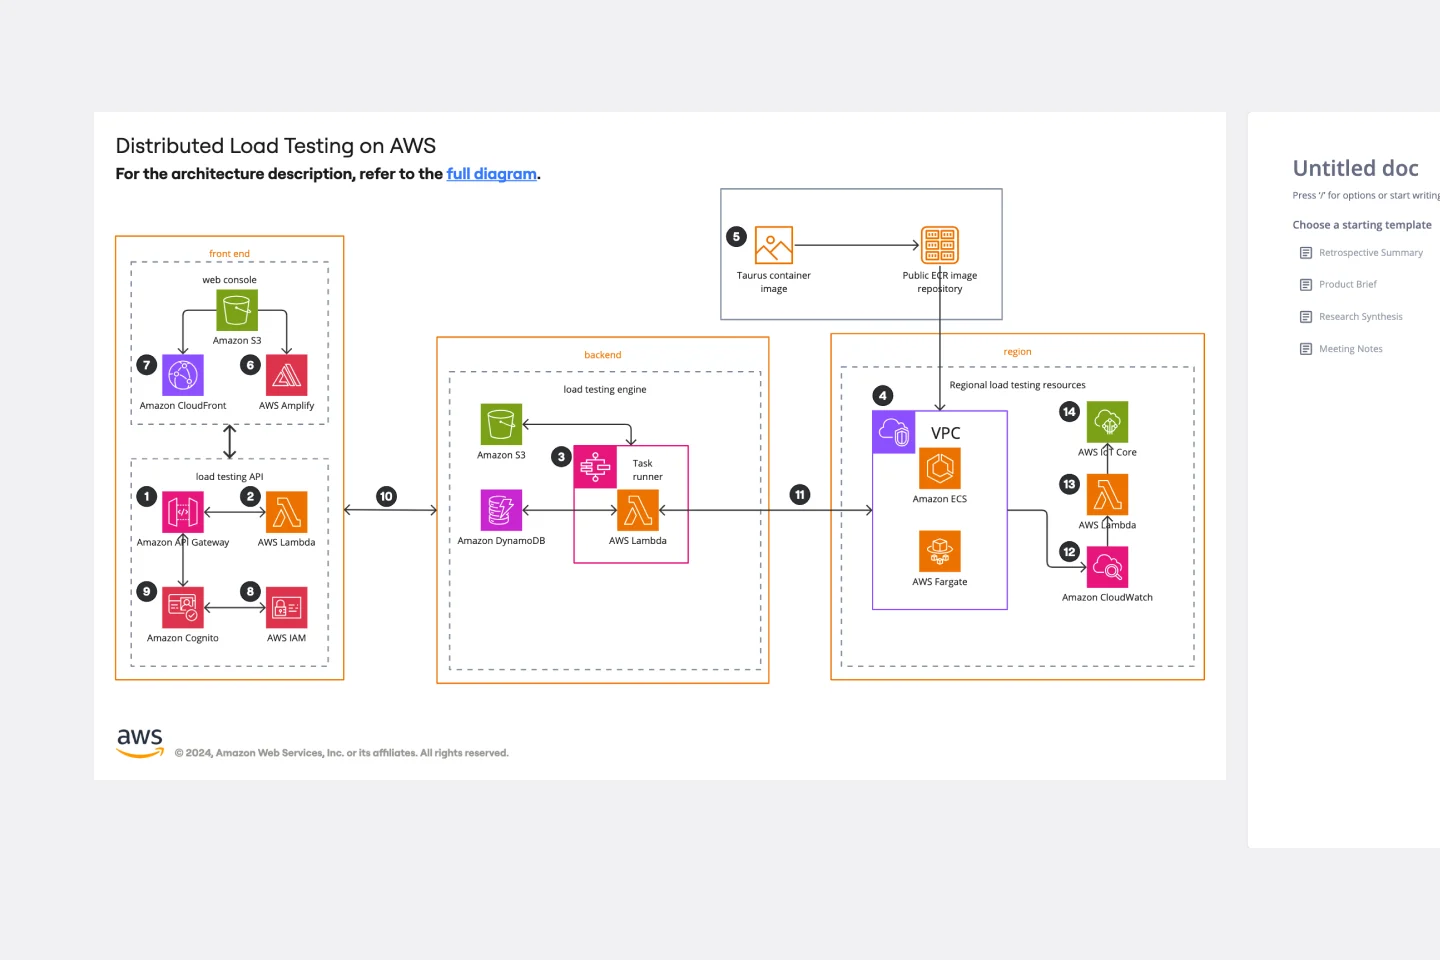
The AWS Architecture Diagram is a visual representation of the AWS framework, and it also translates the best practices when using Amazon Web Services architecture. You can now have an overview of your AWS architecture with Miro’s AWS Architecture Diagram Template, track your cloud solutions easily, and optimize processes like never before.

Cisco Network Diagram Template
Works best for:
Software Development, Diagrams
Cisco offers data center and access networking solutions built for scale with industry-leading automation, programmability, and real-time visibility. The Cisco Data Network Diagram uses Cisco elements to show the network design of Cisco Data Networks visually.

UML Diagram Template
Works best for:
Diagrams, Software Development
Originally used as a modeling language in software engineering, UML has become a popular approach to application structures and documenting software. UML stands for Unified Modeling Language, and you can use it to model business processes and workflows. Like flowcharts, UML diagrams can provide your organization with a standardized method of mapping out step-by-step processes. They allow your team to easily view the relationships between systems and tasks. UML diagrams are an effective tool that can help you bring new employees up to speed, create documentation, organize your workplace and team, and streamline your projects.